
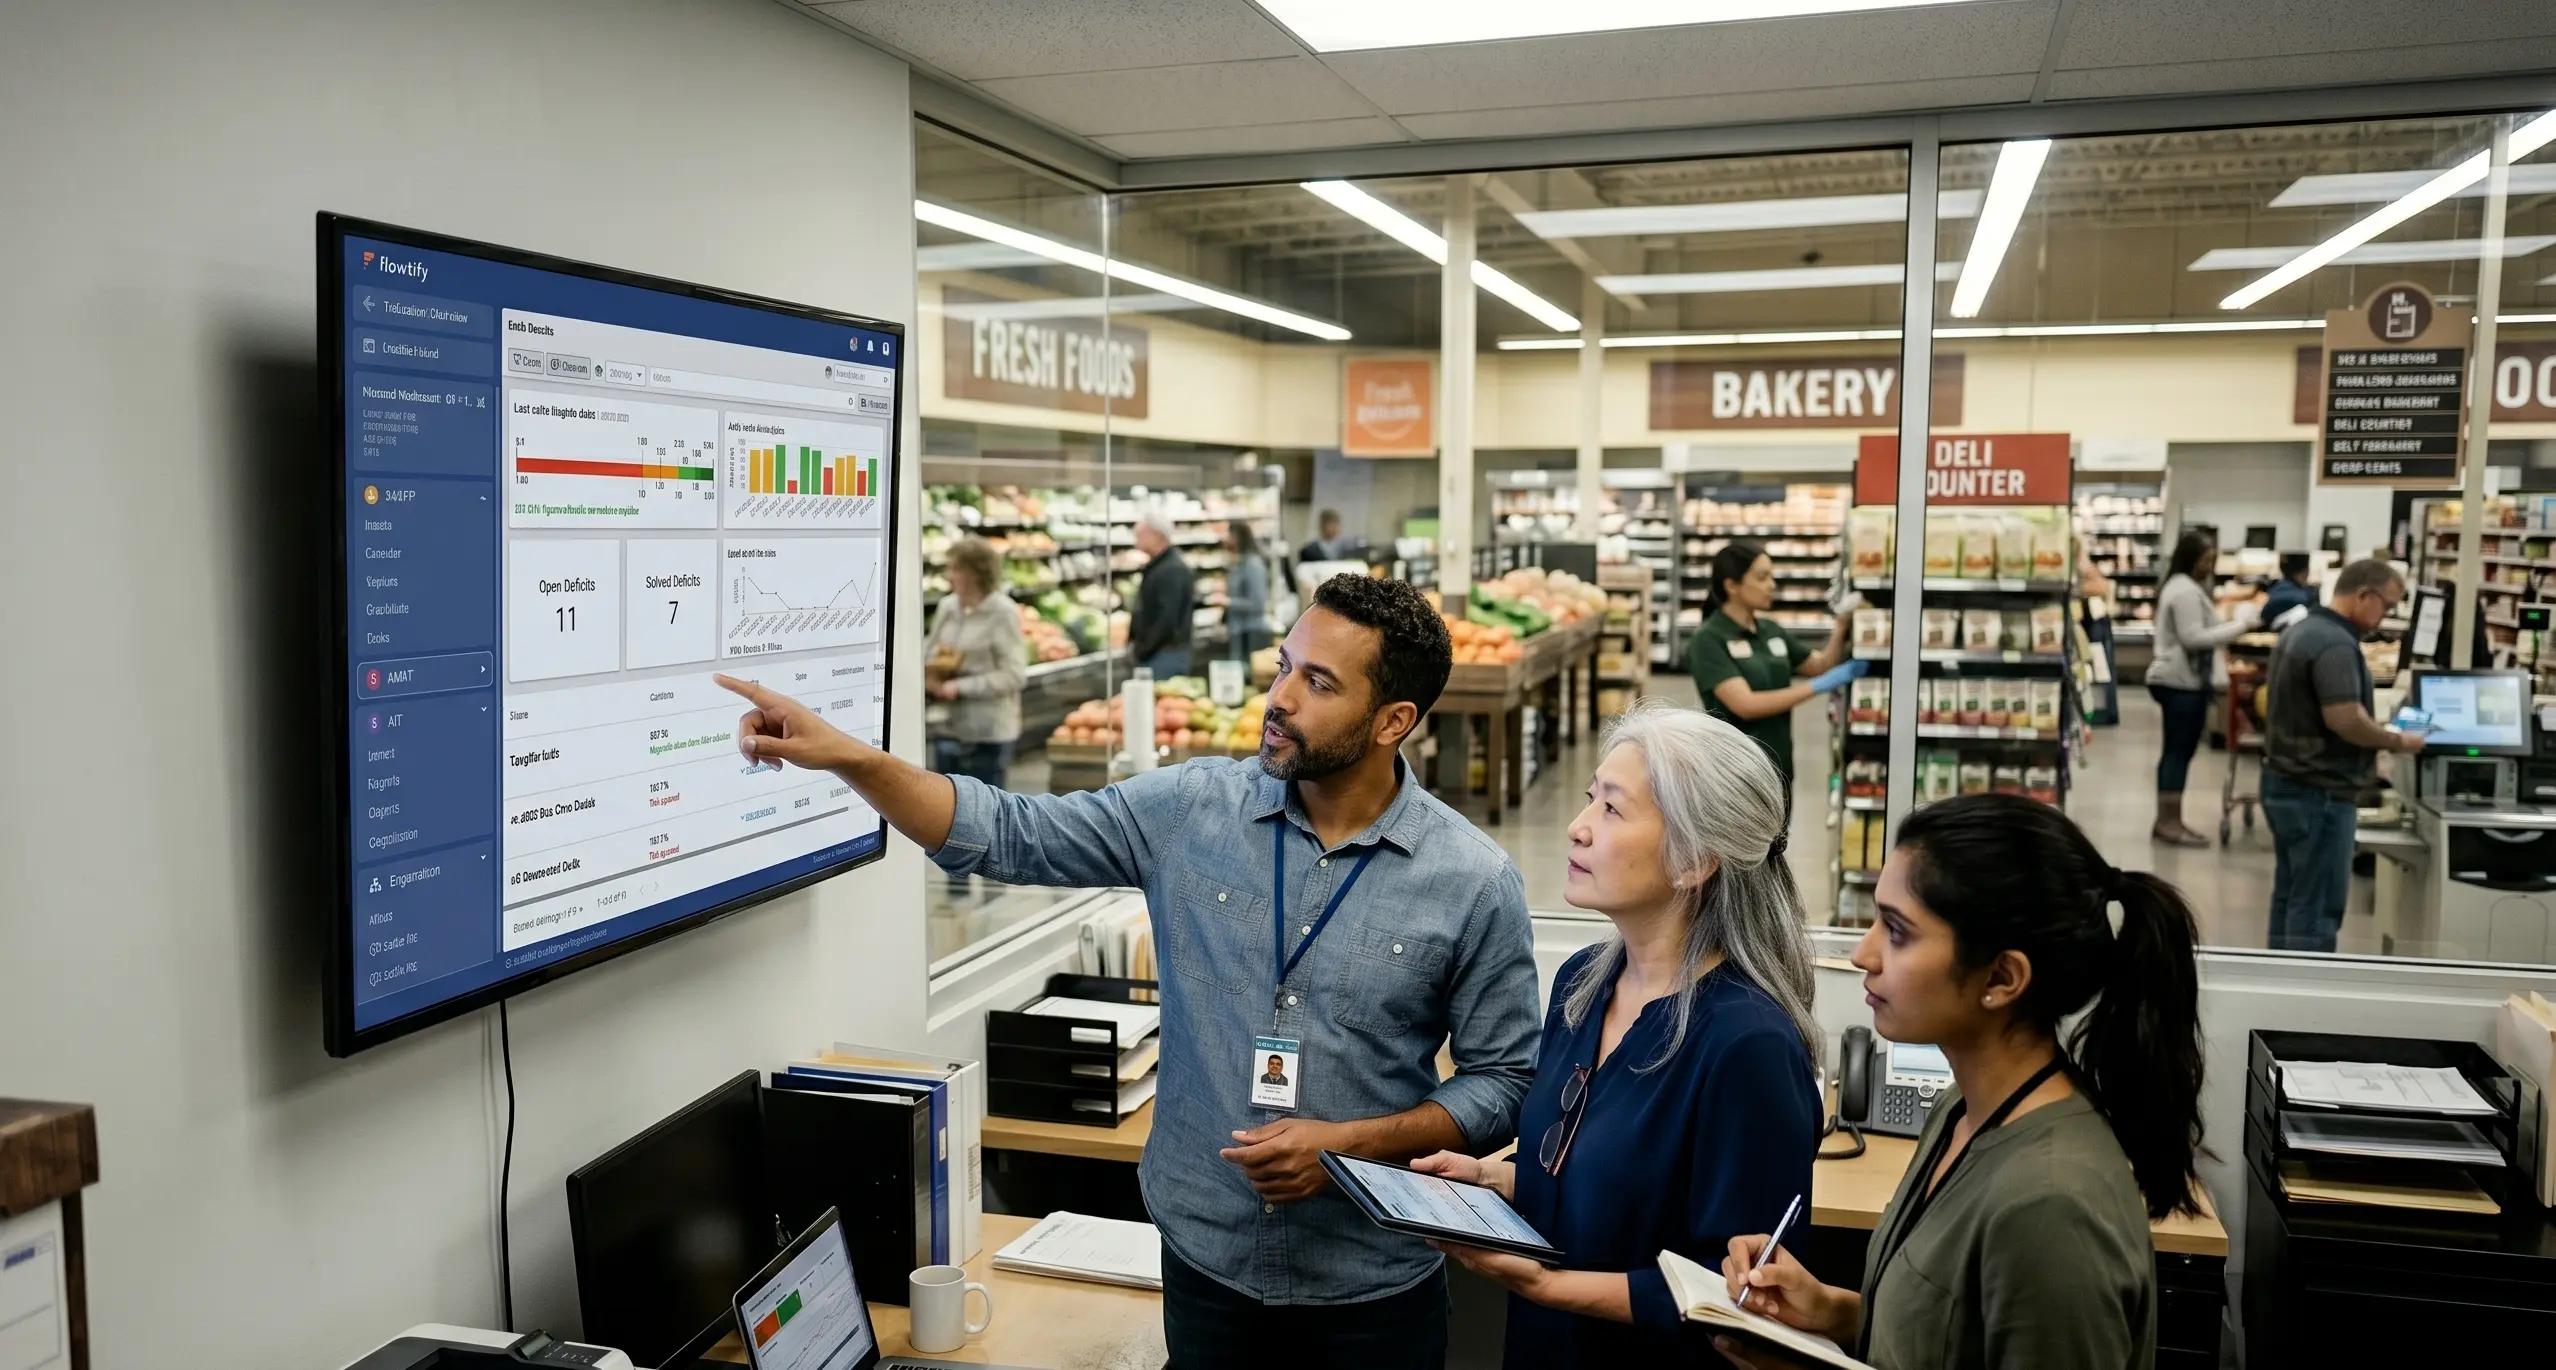
Cross-location analysis and steering of quality processes
Documentation becomes steering, across all locations.
When data exists but doesn't move anything
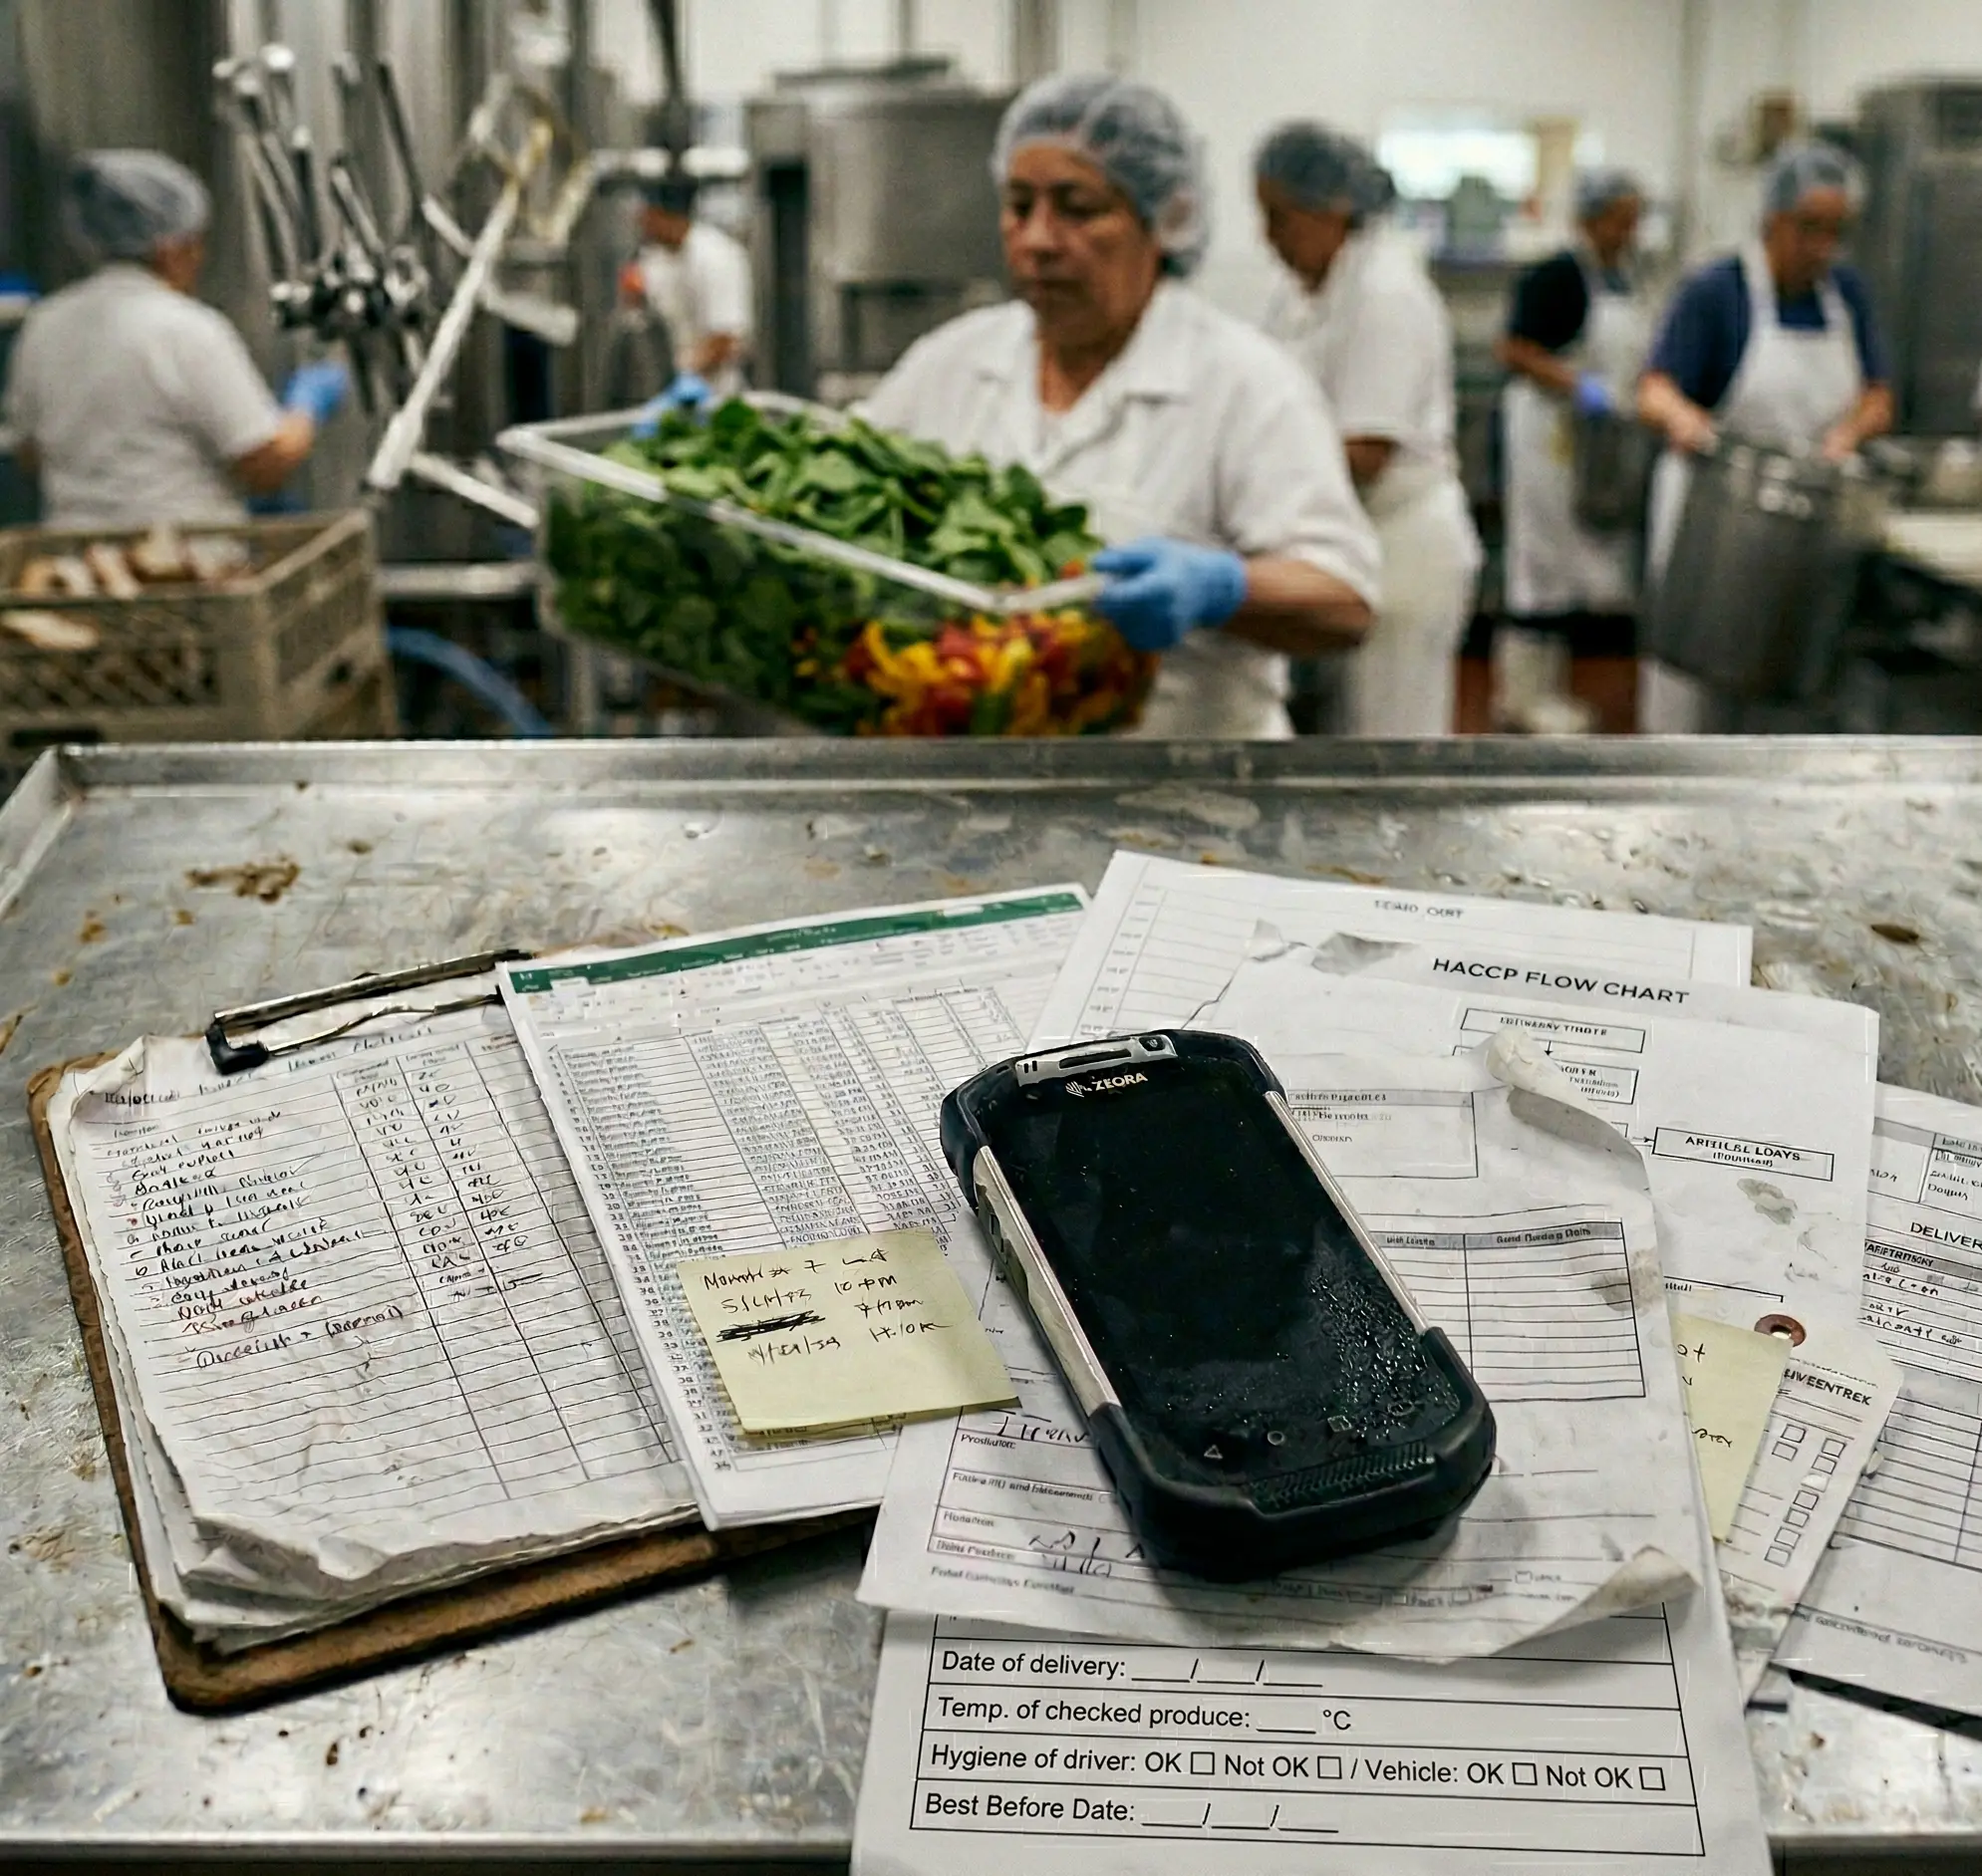
Even with regular documentation, the foundation for reliable steering is often missing. On the floor as much as at headquarters.
Data sits scattered across folders, files, or separate tools. Deviations get logged but not systematically analyzed. What's missing is comparability across sites and over time.
Steering becomes reactive. Patterns only show up once they've already taken hold.
STRUCTURE → VISIBILITY → DECISION
Structure, not chance: how sites become comparable
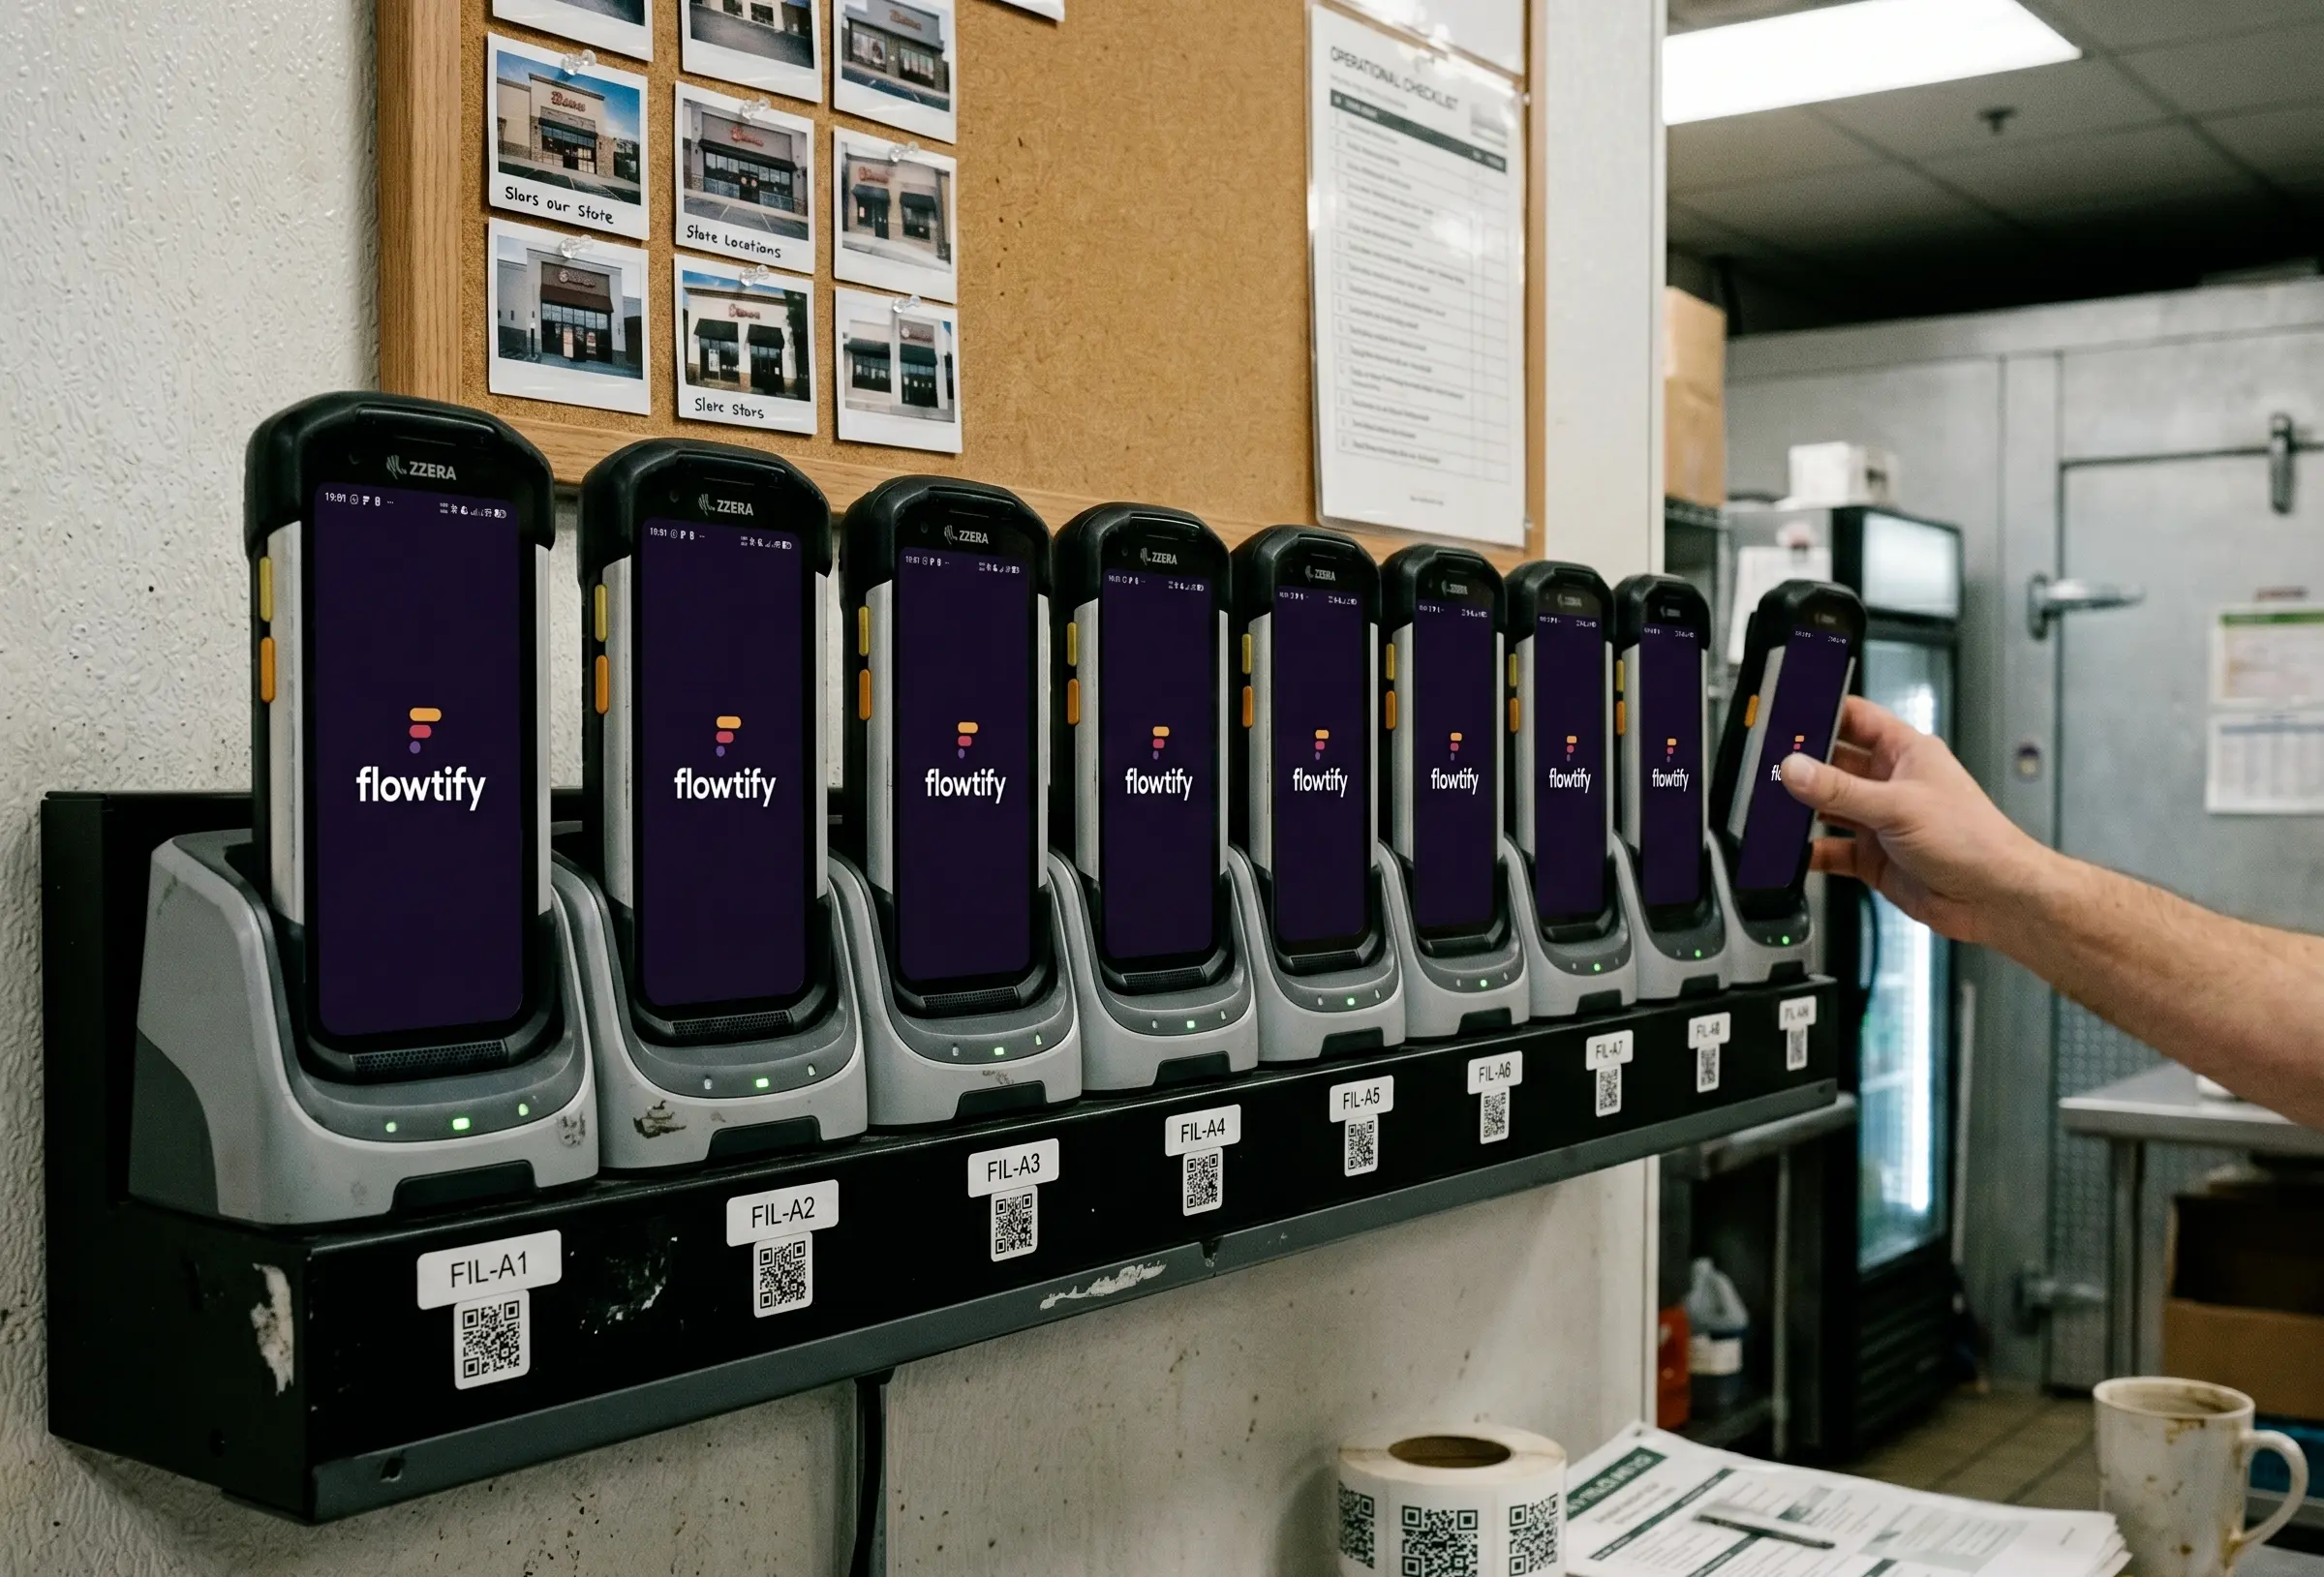
Consistent structure
Same checklists, same scoring, same criteria across every site. So comparison becomes possible in the first place.
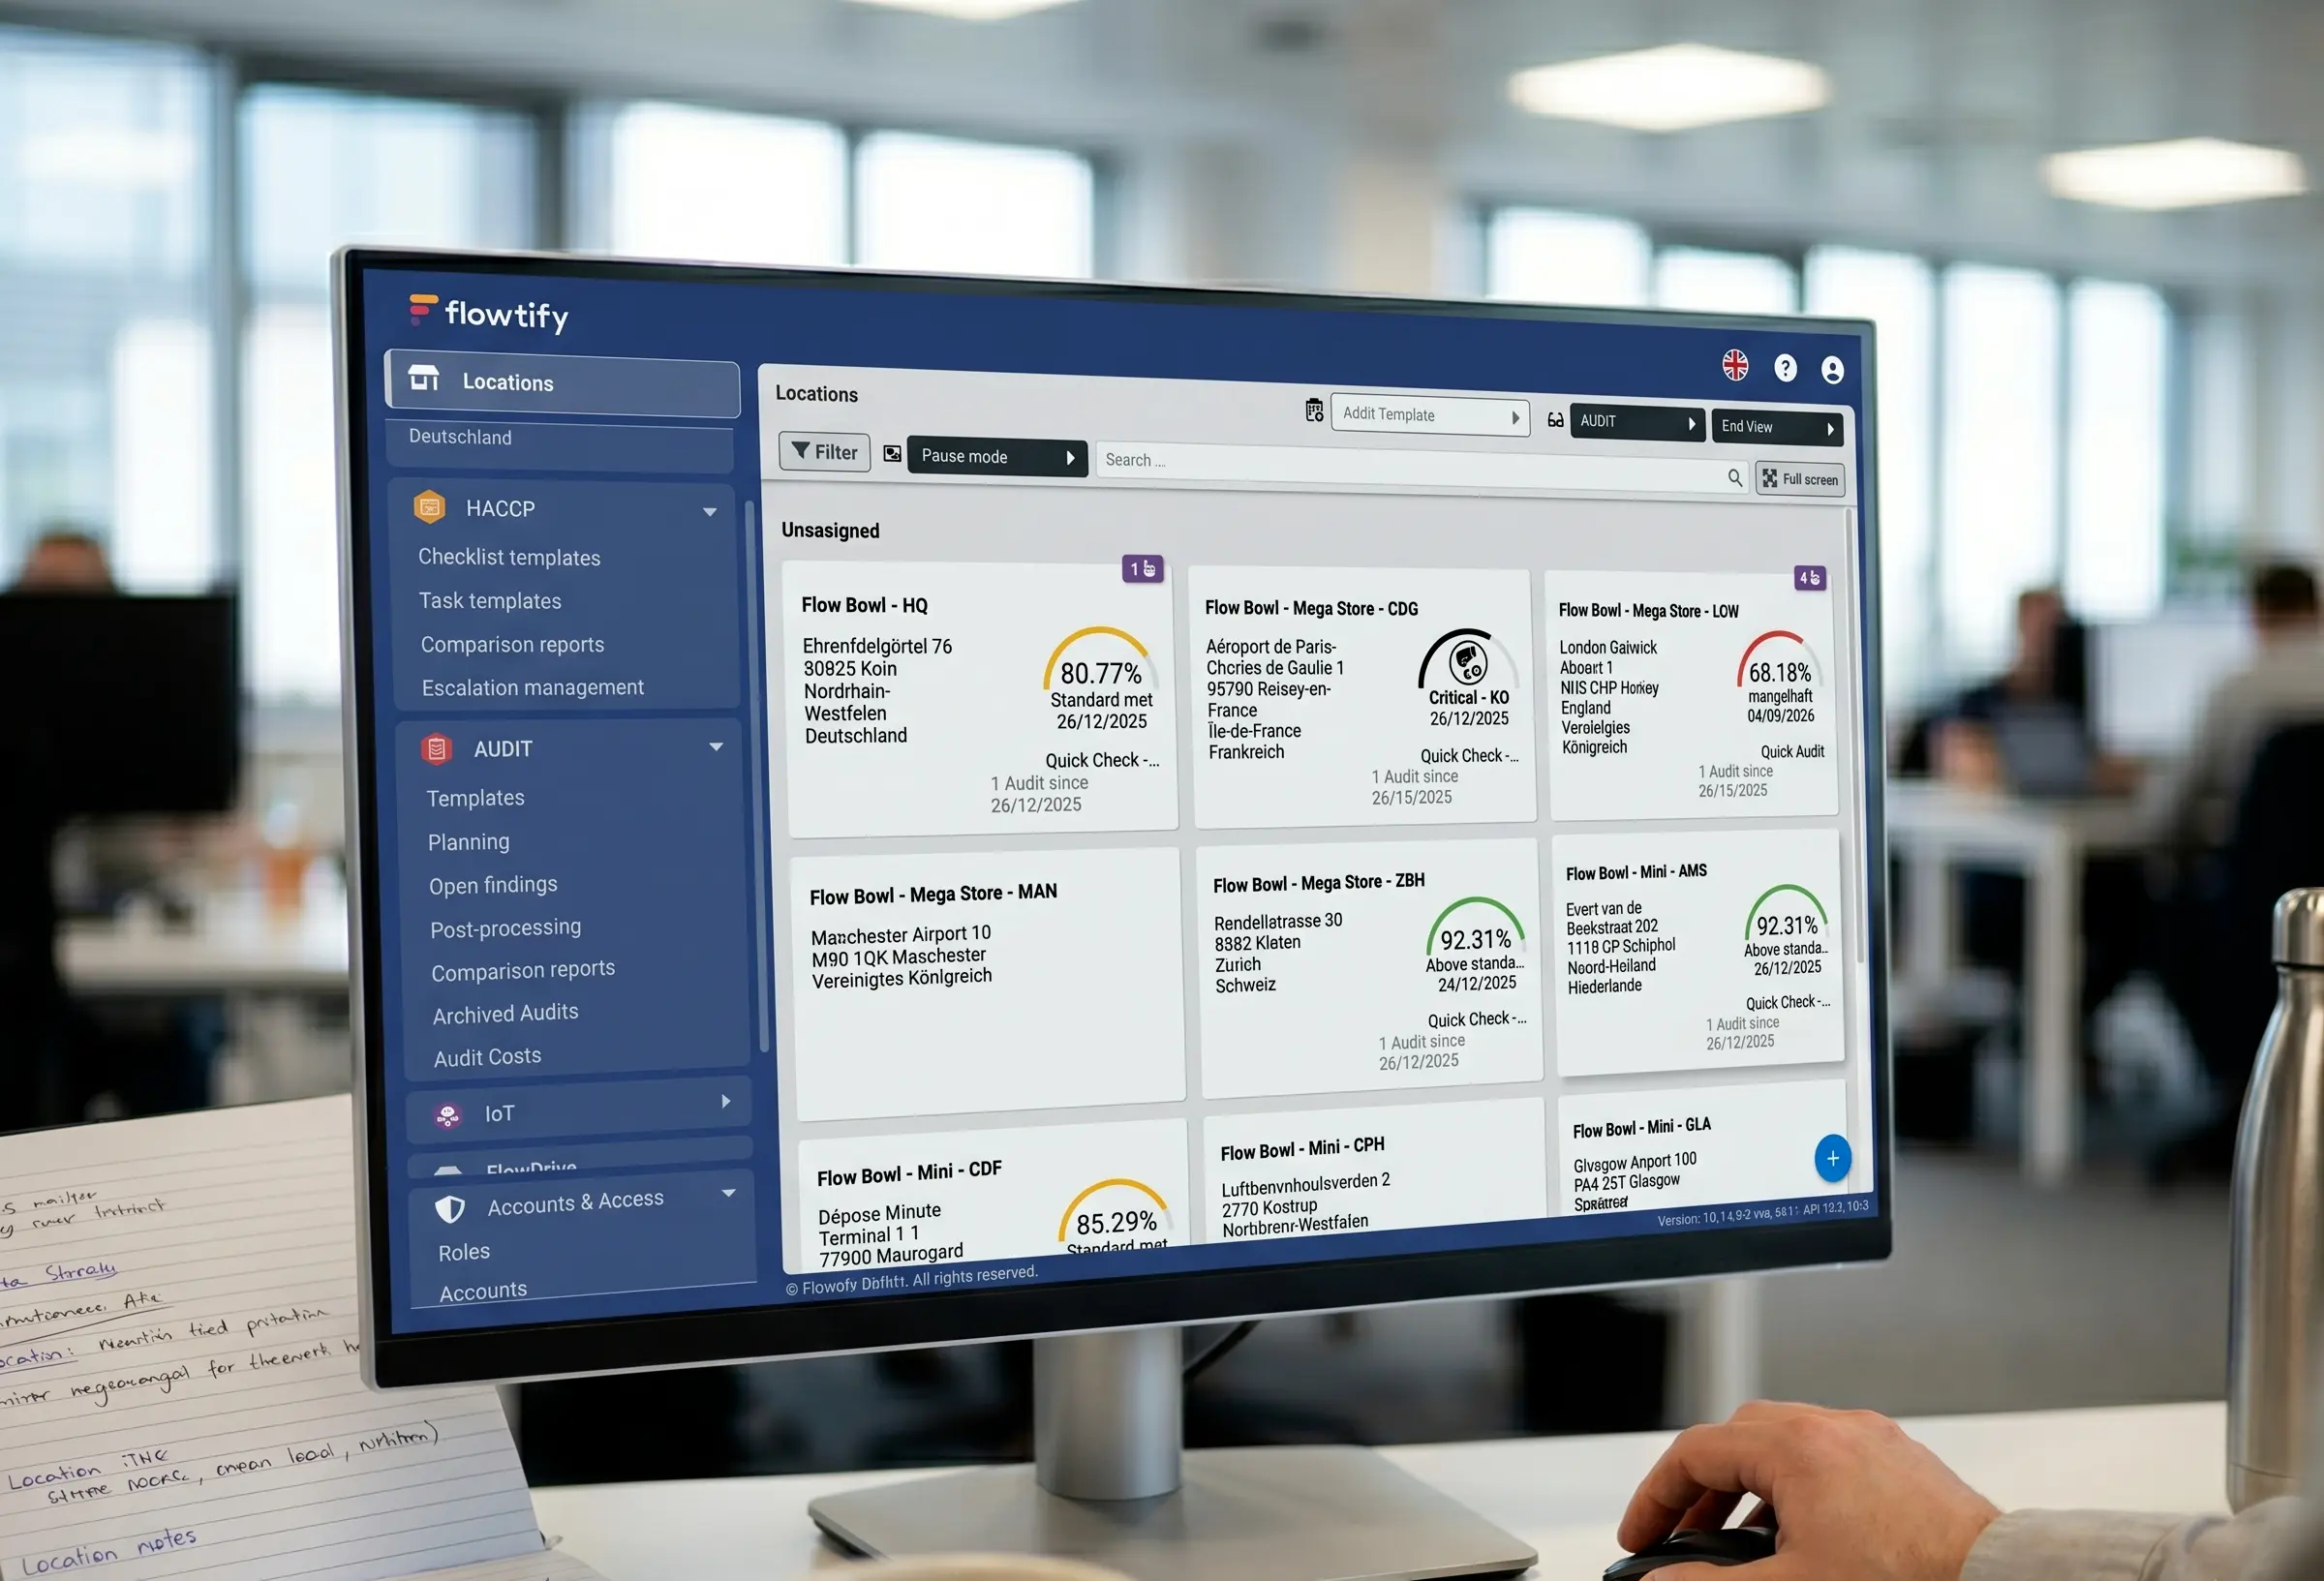
Centralized analysis
Results get pulled together automatically and analyzed across all sites. Without anyone hunting down data manually.
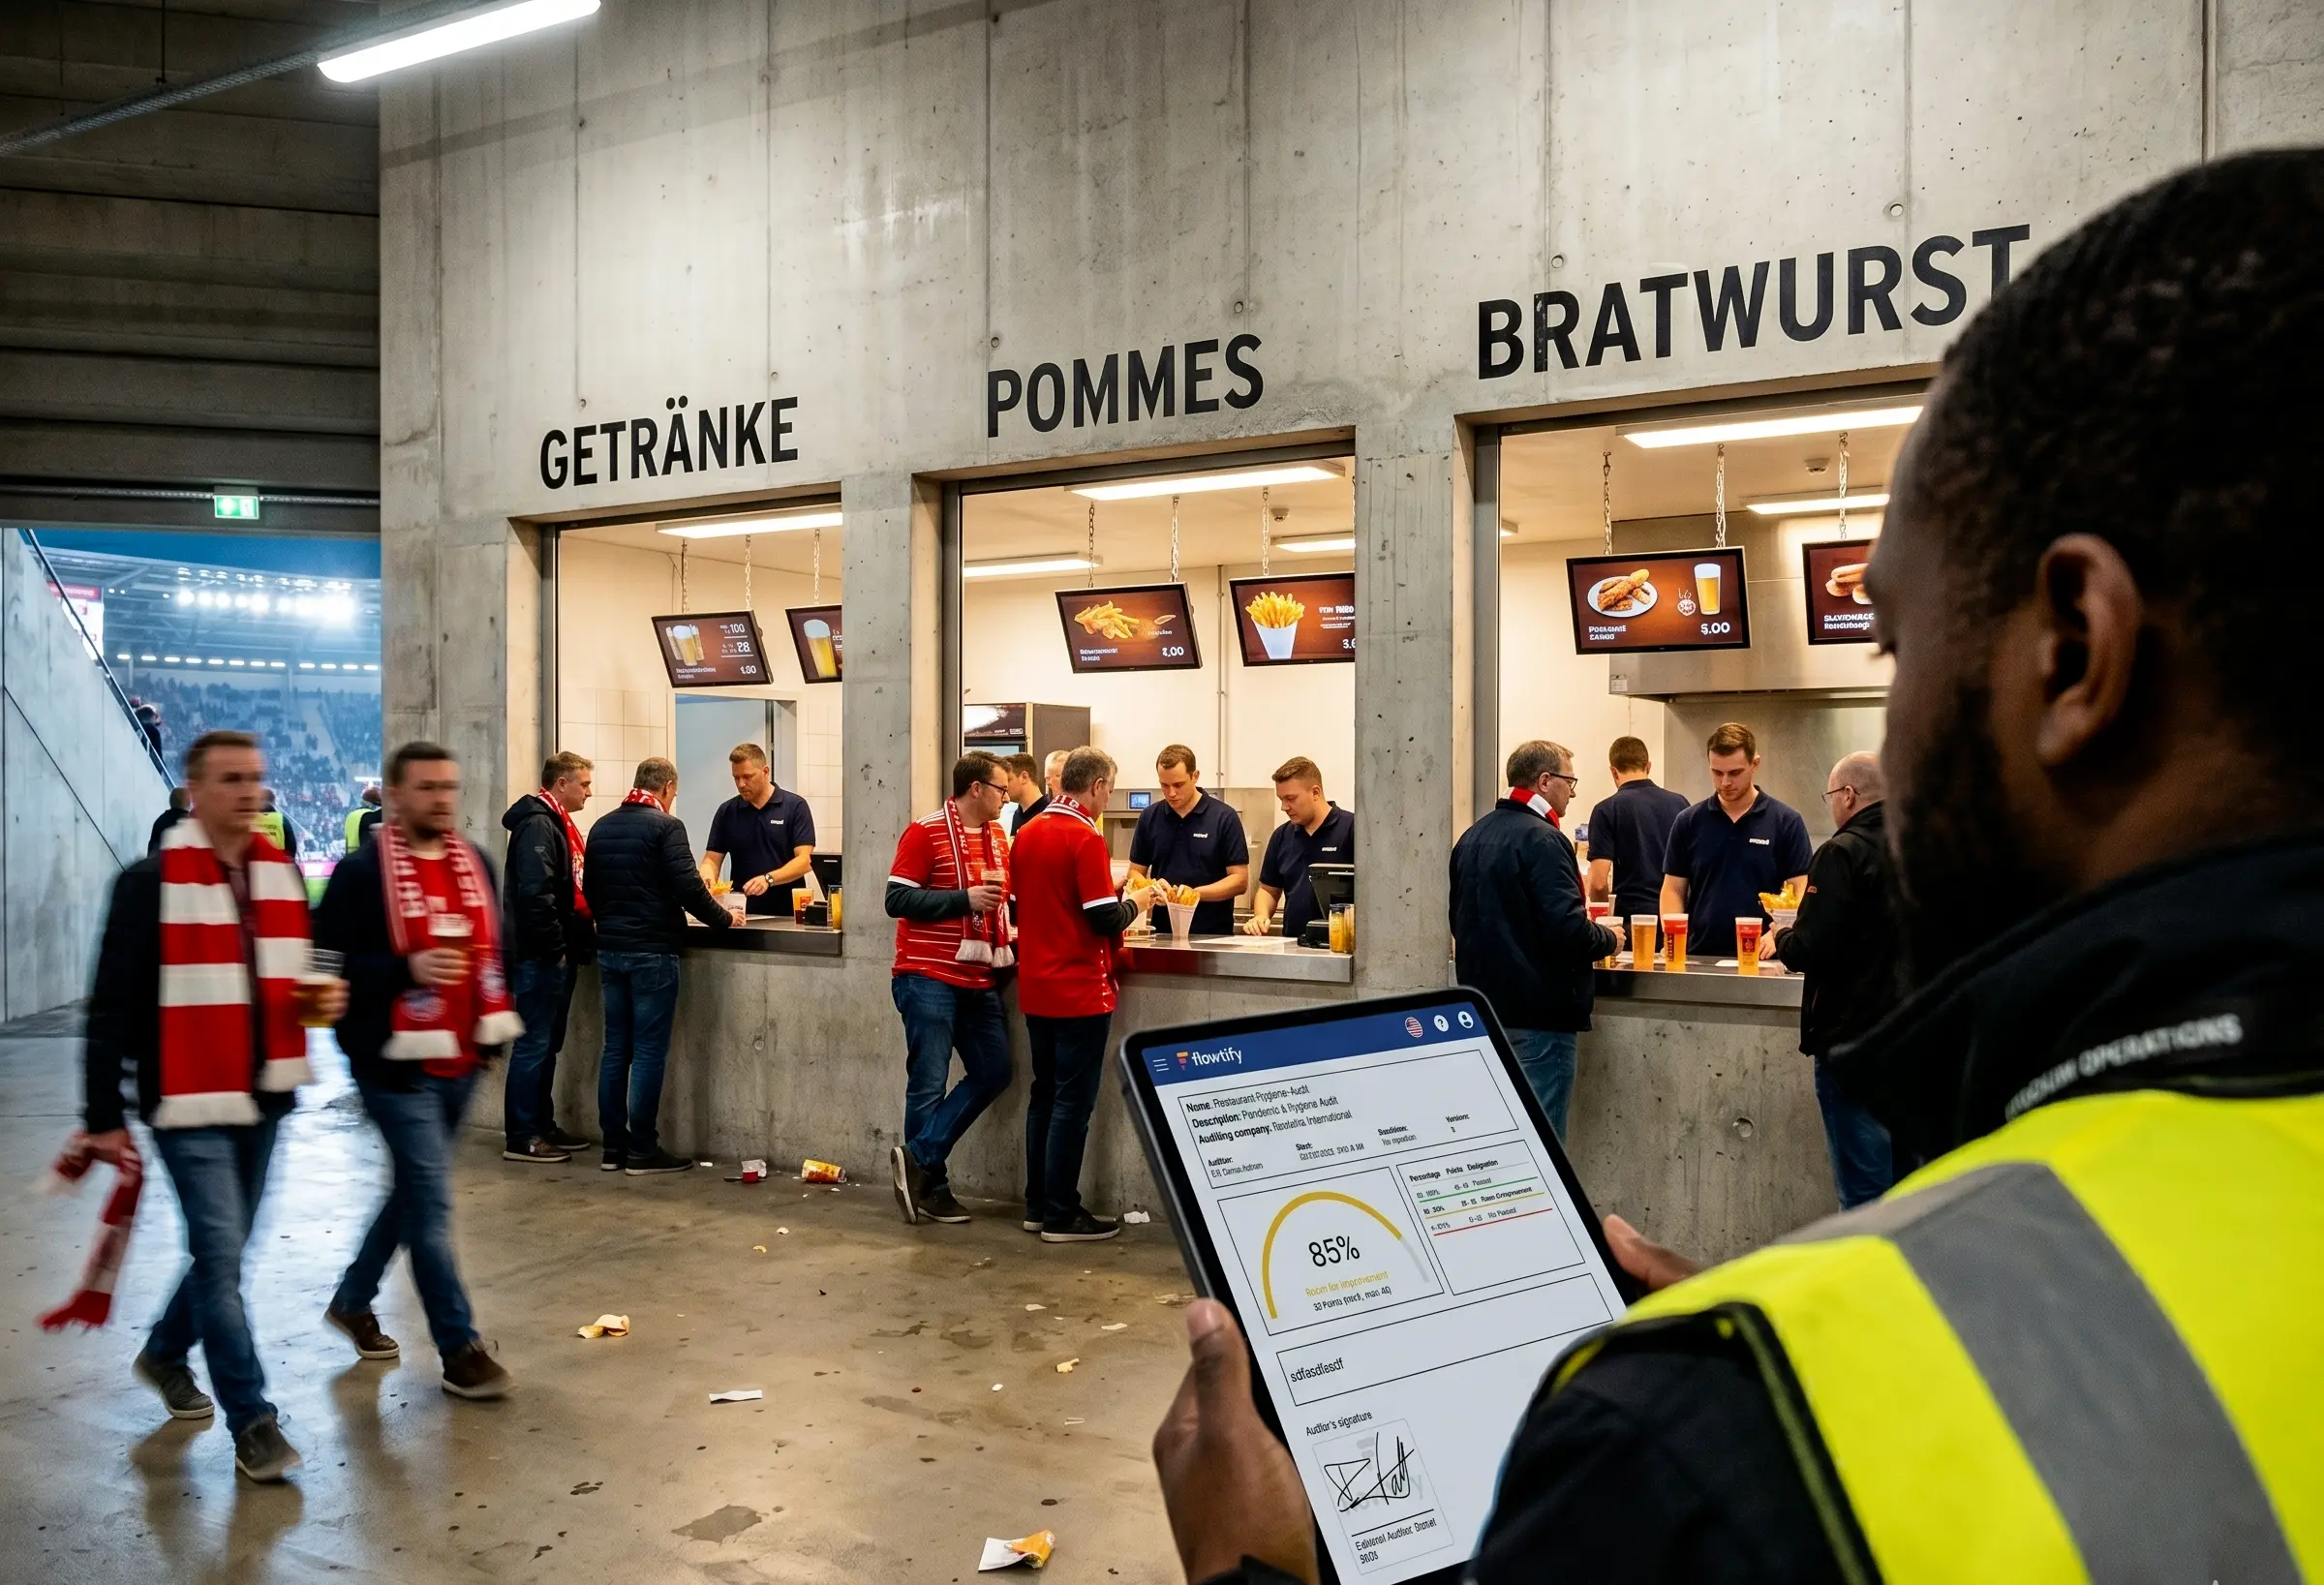
Clear prioritization
Issues show up ranked and ready to address. Instead of drowning in lists.
From comparing locations to taking action

What changes in daily operations
Decisions get solid when operational data can actually be compared. Not as a replacement for experience, but as a reliable counterpart.
- Deviations get caught early, before they take hold.
- Patterns across time and sites become assessable.
- Responsibilities and actions are clearly assigned.
- Cases stay traceable through to completion.
- Sites, concepts, and regions can be compared directly.
Activity that pays off
Related topics

Steer quality across sites
How central guidelines reach every site reliably and take effect in daily operations
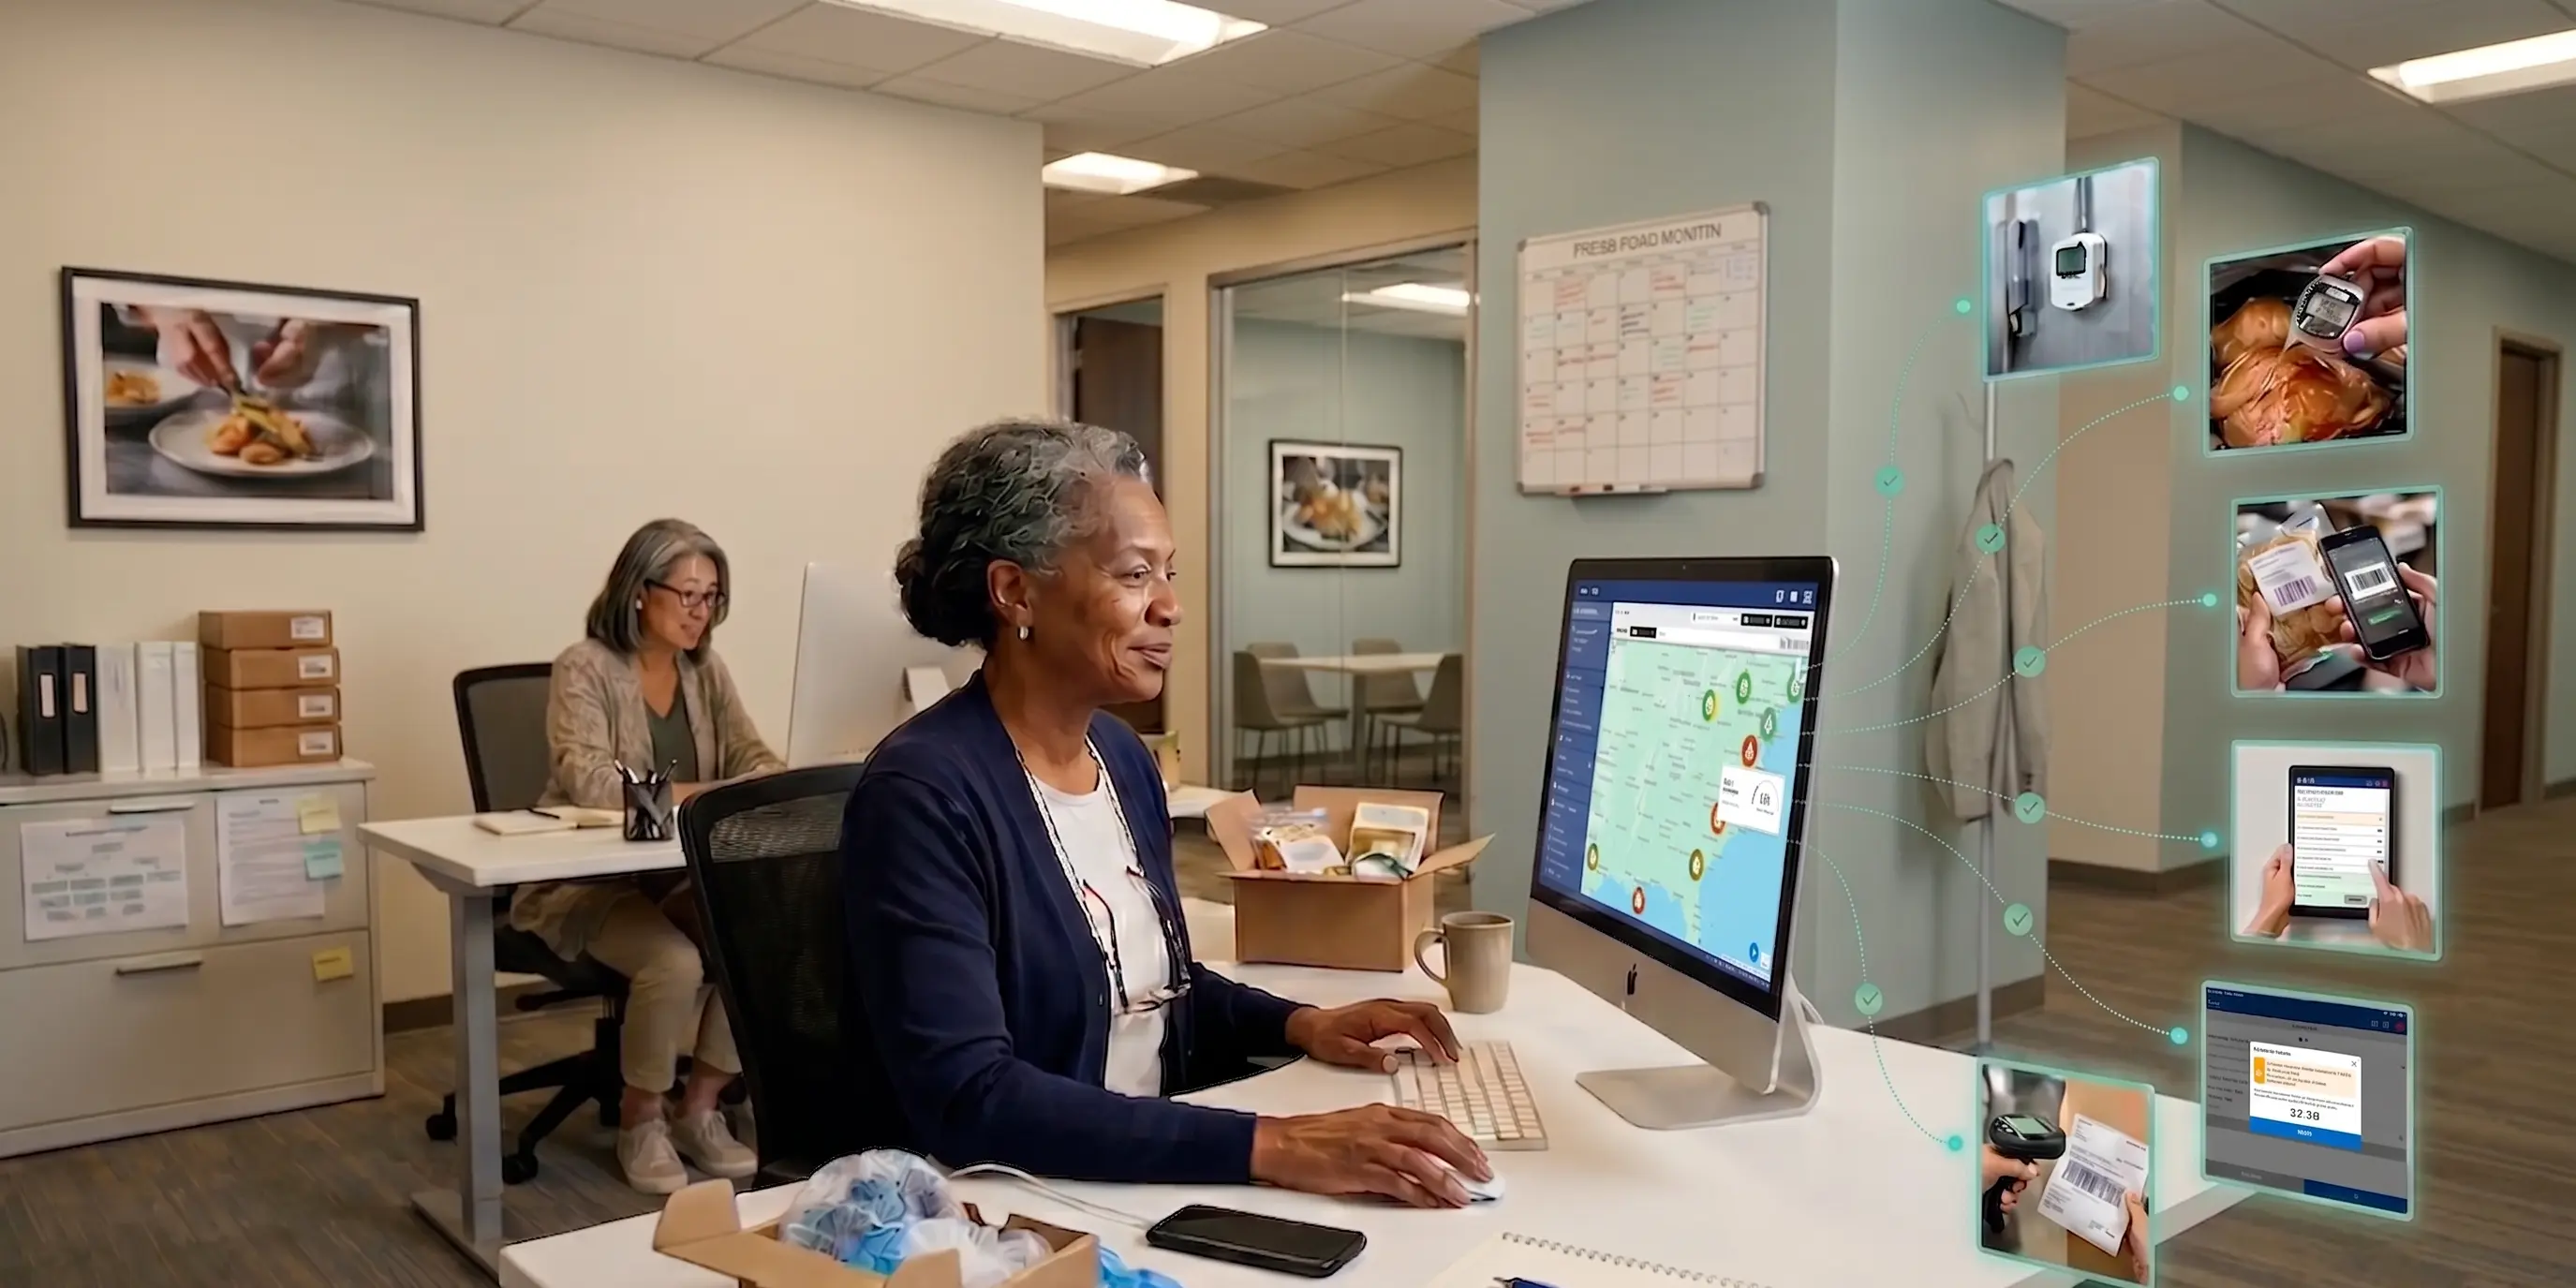
Analyze quality enterprise-wide
How site comparisons lead to company-wide decisions
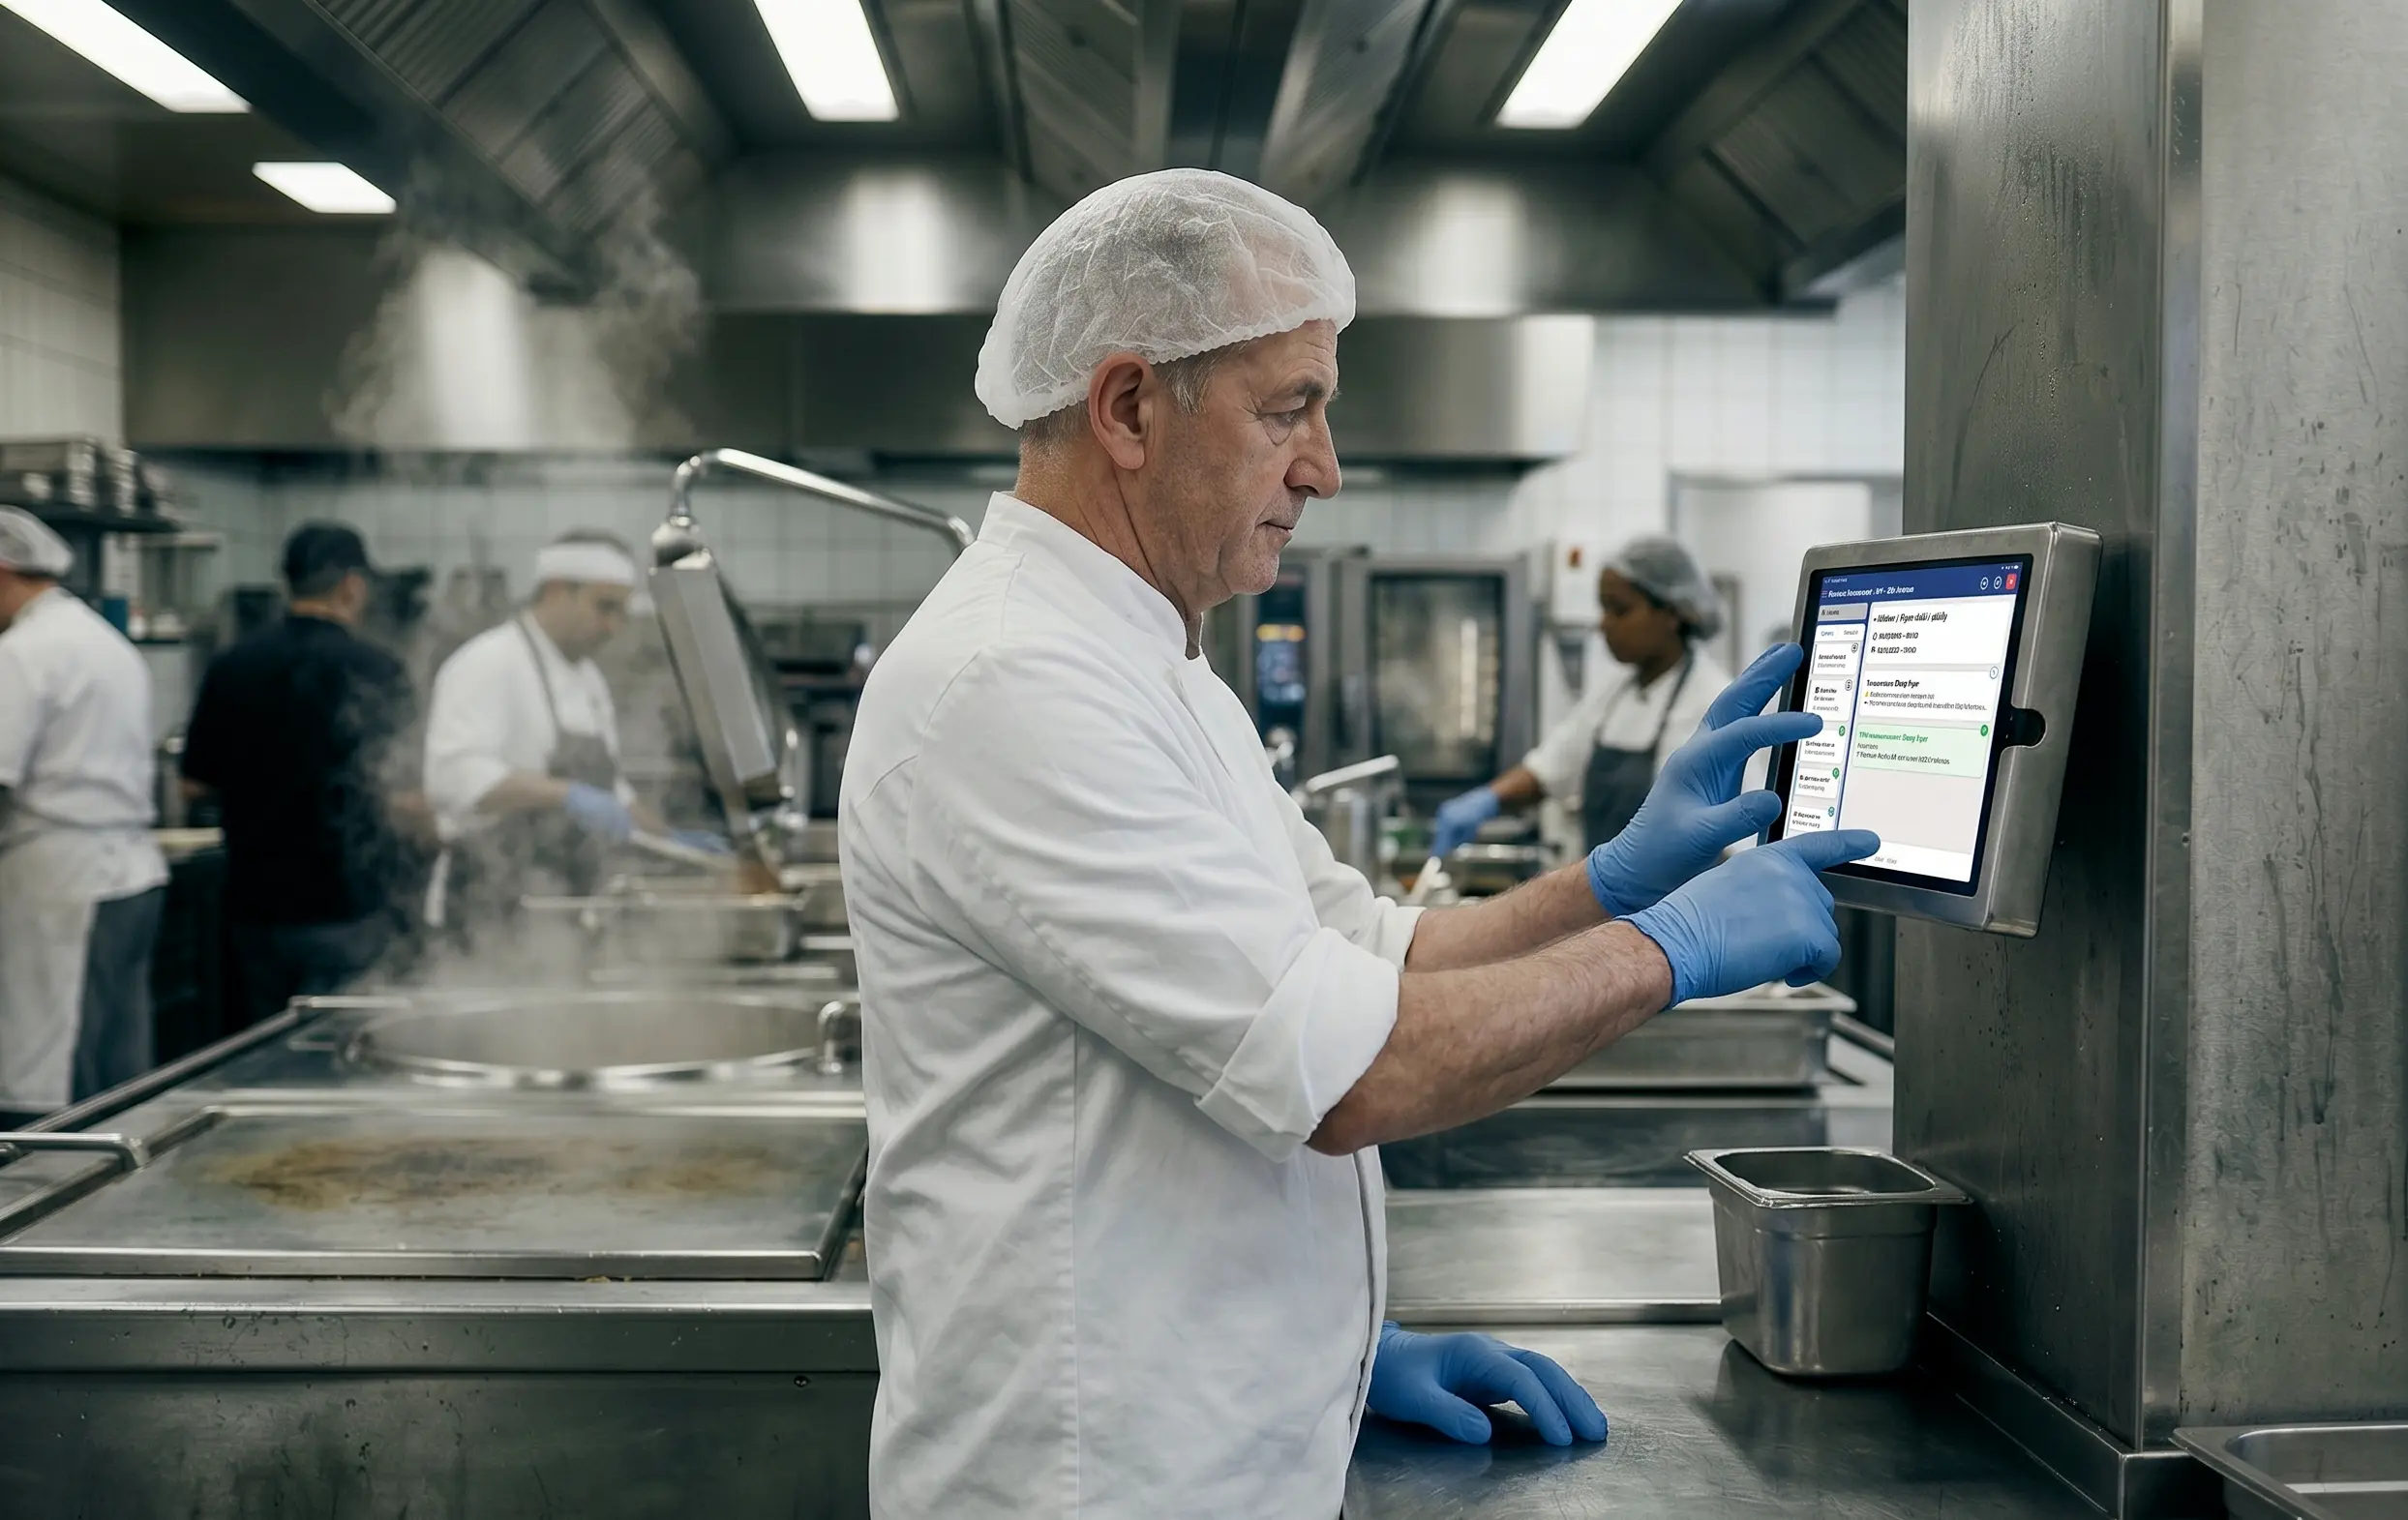
Effectiveness in daily operations
How teamwork turns into real control when deviations get caught and resolved early
Assess your requirements
If audits should not only document but enable steering, a short alignment is worthwhile.